📉 📊 📈 Stats Nerdery

I have a half-baked theory about why it seems like margin of victory matters even more in the NET than other rankings. Warning: gonna get nerdy here. I started a different topic so those allergic to acronyms and abbreviations can safely ignore.

Most predictive rankings (KenPom, Torvik, EvanMiya, etc) are based around calculating the “adjusted efficiency margin,” basically rating teams by their margin of victory (or defeat) adjusted for opponent strength and location of game. There are different choices to be made about the factors that go into that adjustment, but at their core, these rankings try to do the same thing. They translate your 4 pt win at Florida State into how you would do against an average team on a neutral floor, and then rinse and repeat for all your games. If we broke it down, an adjusted efficiency margin is composed of 1) what was the scoring margin in the game (accounting for pace), 2) where was the game played, 3) who was the game against?

The NET is different in that it has an adjusted efficiency margin component, but it also has something called the “Team Value Index.” This is a component that explicitly is supposed to ignore margin of victory, and just provides a value based on 1) did you win or lose, 2) where was the game played, 3) who was the game against?

This is an inference, but I think they did this because they were sensitive to situations where a team improved a ranking with a loss, so they wanted to try to make wins worth a little more. Under the NET, by design there should be a meaningful difference between winning by 1 and losing by 1 against the same team. Most systems would treat those two things as being close to equal.

However, my half-baked theory is that by doing this, it actually amplified the effect of blowout wins, because now the ranking system doesn’t just see that you won by 20 pts against a team, but also gives you credit for winning the game itself.

Edit: I think I got it backwards! Illinois St made a bigger jump in the pure adjusted efficiency margin ratings vs the NET after their blowout win against Indiana St. Oh well, leaving the post up because I spent too much time writing it.

Caveat: since the NET only is released as a rank order as opposed to some rating value (like any other system), it’s hard to know how true this is. Also, this is half-baked, so feel free to poke holes in this.


4 Likes

It doesn’t seem like that would increase the value of MoV in NET, though. Feels like it would do the opposite.

Since we’re opining on stats-stuff, KenPom has said many times that, analytically, a team winning by 1 or losing by 1 are almost identical results when constructing a predictive model. And maybe he’s right, but I still find it weird that a team which goes 0-29 against a fairly difficult schedule, losing every game by 1, but then wins its final game by 50 (to finish 1-29) would be considered an above average team. Perhaps even a “bubble team” if the schedule was tough enough. KenPom would label it the “unluckiest” team of all time. I just find that odd.

1 Like

Yeah, I’ve been thinking about it more, and I think your right, it is the opposite. The teams that should do unusually well in the NET vs other systems should be the ones that win a lot of close games. And teams that lose close ones should do worse vs other systems. Since the opponent and game location inputs should be the same each between the NET components, the efficiency margin essentially gets discounted by an amount equal to the weight the Team Value Index has in the formula (which we don’t know).

Example: In an efficiency margin-only system, it should be 5 points better for your ranking to win by 10 points over an average team on a neutral court vs 5 points in the same situation (assume pace is equal). Under the NET, those two wins are equivalent in the Team Value Index component, which should dilute the efficiency margin difference that’s still there.

1 Like

Me reading this conversation.

YARN | He's good. | Billy Madison (1995) | Video gifs by ...

3 Likes

Yeah, if you like wrong initial answers that have to do a 180. At least I got there?

I think it depends on how good the ranking thinks the opponent is and how much it weighs that. My dilettante level view has been that the NETs efficiency rankings are much closer to a pure efficiency ranking than Kenpom, et al. So when a team blows out a bad team, the NET will weigh that more than Kenpom. But when a team blows out a good team, it’s vice versa. Hence what you’re seeing with Indiana St and Illinois state. I think

1 Like

If, going into a game, a player is 30% from 3 on 3 attempts a game, do you want them shooting 3s that game?

  • Yes
  • No
0 voters

The core problem with NET is that it doesn’t know what it’s measuring. It’s a ranking tool, but it’s ranking on what metric? NET, like RPI, is a couple things mashed together with the result that we get… something… I mean it’s an ordered list, I guess that’s what we wanted…

2 Likes

For me, you could go to negative numbers on the percentage, and I’d still be a yes.

1 Like

Yeah if you’re open shoot it.

If you let a poor shooting percentage dictate your future shot selection, then that’s just a self-fulfilling prophecy. Unless it’s poor on extremely heavy volume or you are Dante Harris, shoot the three.

2 Likes

That makes sense @AdventiveQuasar. Basically an upset bonus is what it works out to. If you’re expected to win/lose, no difference. But an upset win or loss moves the needle more.

1 Like

I think it’s very possible they undercooked the adjustment for opponent and game location. Obviously it’s hard to say because they only release the ordered list, and not the underlying values.

1 Like

Reaching peak nerdery here. Found an article from a NCSU fan who tried to reverse engineer the NET:

It’s beyond my capabilities to evaluate how accurate the work is, but I think this is the money quote:

I’m not so sure how the two components are combined to create the final ranking. However, it’s clear that the Efficiency is more important. I would count the Efficiency ranking at 80% and the Value ranking at 20%. For example, a team that is 10th in Efficiency and 25th in Value would have a NET ranking of about 13, because 10 x 80% + 25 x 20% = 13.

2 Likes

Did you want BVP shooting open 3’s last year? He is exactly who you are asking about. I don’t know what answer to expect from you, but thought I would pose the question that way.

Yeah I guess it depends on the person and feelings about it on a case by case LOL. Id say in general if you are 30% from 3 you shouldn’t be hunting the 3pt shot, but you should be taking atleast one attempt if you find yourself wide open and catching the ball in rhythm

I’d say, if you’re still a 30% shooter even when you find yourself wide open and catching the ball in rhythm… then you shouldn’t take that shot. The other team wants you to take that shot, so you’re not really “keeping the defense honest” by doing that.

But if you’re actually a bit better in that scenario, then yes, take it.

1 Like

I do wonder how reflective your shooting percentage at any one point in the season is reflective of where you end up at the end of the season.

Also would depend on the breakdown. Are they better shooting with ball in their hand or open catch and shoot what does the opportunity they are getting look like

1 Like

We don’t have to look far for someone who has explored this question (or at least related ones), eh @hoopsandhoos?

3 Likes

First, I love that this thread exists!

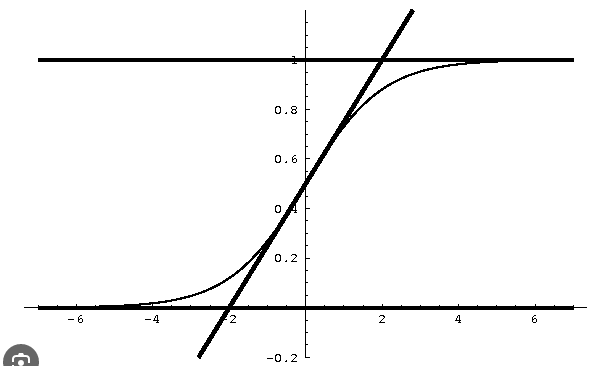
My guess is that the NET’s raw scoring is more linear than that of Torvik/KenPom, so the effects of a single game are more constant. If you think about those raw scores as functions of Adjusted Efficiency, then the NET looks more like a straight line (probably not perfectly because of TVI). Torvik/KenPom look more like an S-curve (sigmoid if you want to get math-y about it). The image below shows the two overlaid on one another. The straight line of the NET means that results from a single game are going to have a constant effect on your overall NET score (again this isn’t exactly reality b/c of TVI). On the Torvik/KenPom side, if you’re closer to one end or the other, then the results of a single game will have less of an effect on your overall Torvik/KenPom score. If you’re in the middle, then it will behave a lot more like the NET scoring function. Which is sort of to say that your starting point for Torvik/KenPom likely matters a bit more than it does for the NET.
image

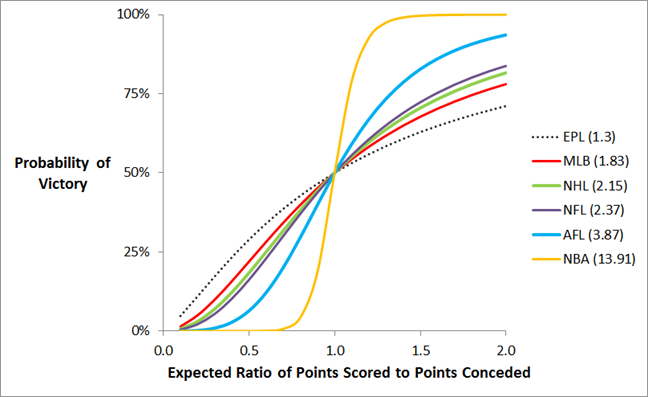
Just for fun, here’s a graph that someone derived for the pythagorean expectation (what Torvik and early-KenPom used). For the NBA, at least, you can see it’s super-steep right around that 1 point scored-to-1 point conceded midpoint and then flattens out hard once you get to the 0.75 and 1.25 ratio.
image

5 Likes

Awesome @pingsc! A couple questions to make sure I’m understanding:

  1. In the S-Curve graph, is the X-axis net efficiency for a single game (adjusted?) and the Y-axis is the effect on overall NET/KP/Torvik score?
  2. When you say “your starting point for Torvik/KenPom likely matters a bit more than it does for the NET,” do you mean that if the result is further off from what the rankings would predict, the result would then have a bigger effect on the rankings in the NET than the other rankings?

Also, for what it’s worth, South Carolina got demolished away at Auburn, and dropped about the same amount ranks-wise in both NET and Torvik.