Gassaway has long been a proponent of possession advantage being a major key to success in college hoops and has written quite a bit about it over the years. UNC in particular was typically great at offensive rebounding and didn’t turn the ball over much. Which was how they’d magically generate surprisingly good offenses despite them often having surprisingly inefficient offenses.
1 Like
Yeah Gill was closer to 6’6 than 6’8. His hair made him look taller than he was.
4 Likes
I also think DT was one of the few college hoops players whose official heigh did not actually overstate how tall he really was.
2 Likes
You might be onto something regarding OR%. Here’s ours in the Bennett era (or% on the left is ours and on the right is what our defense allowed):
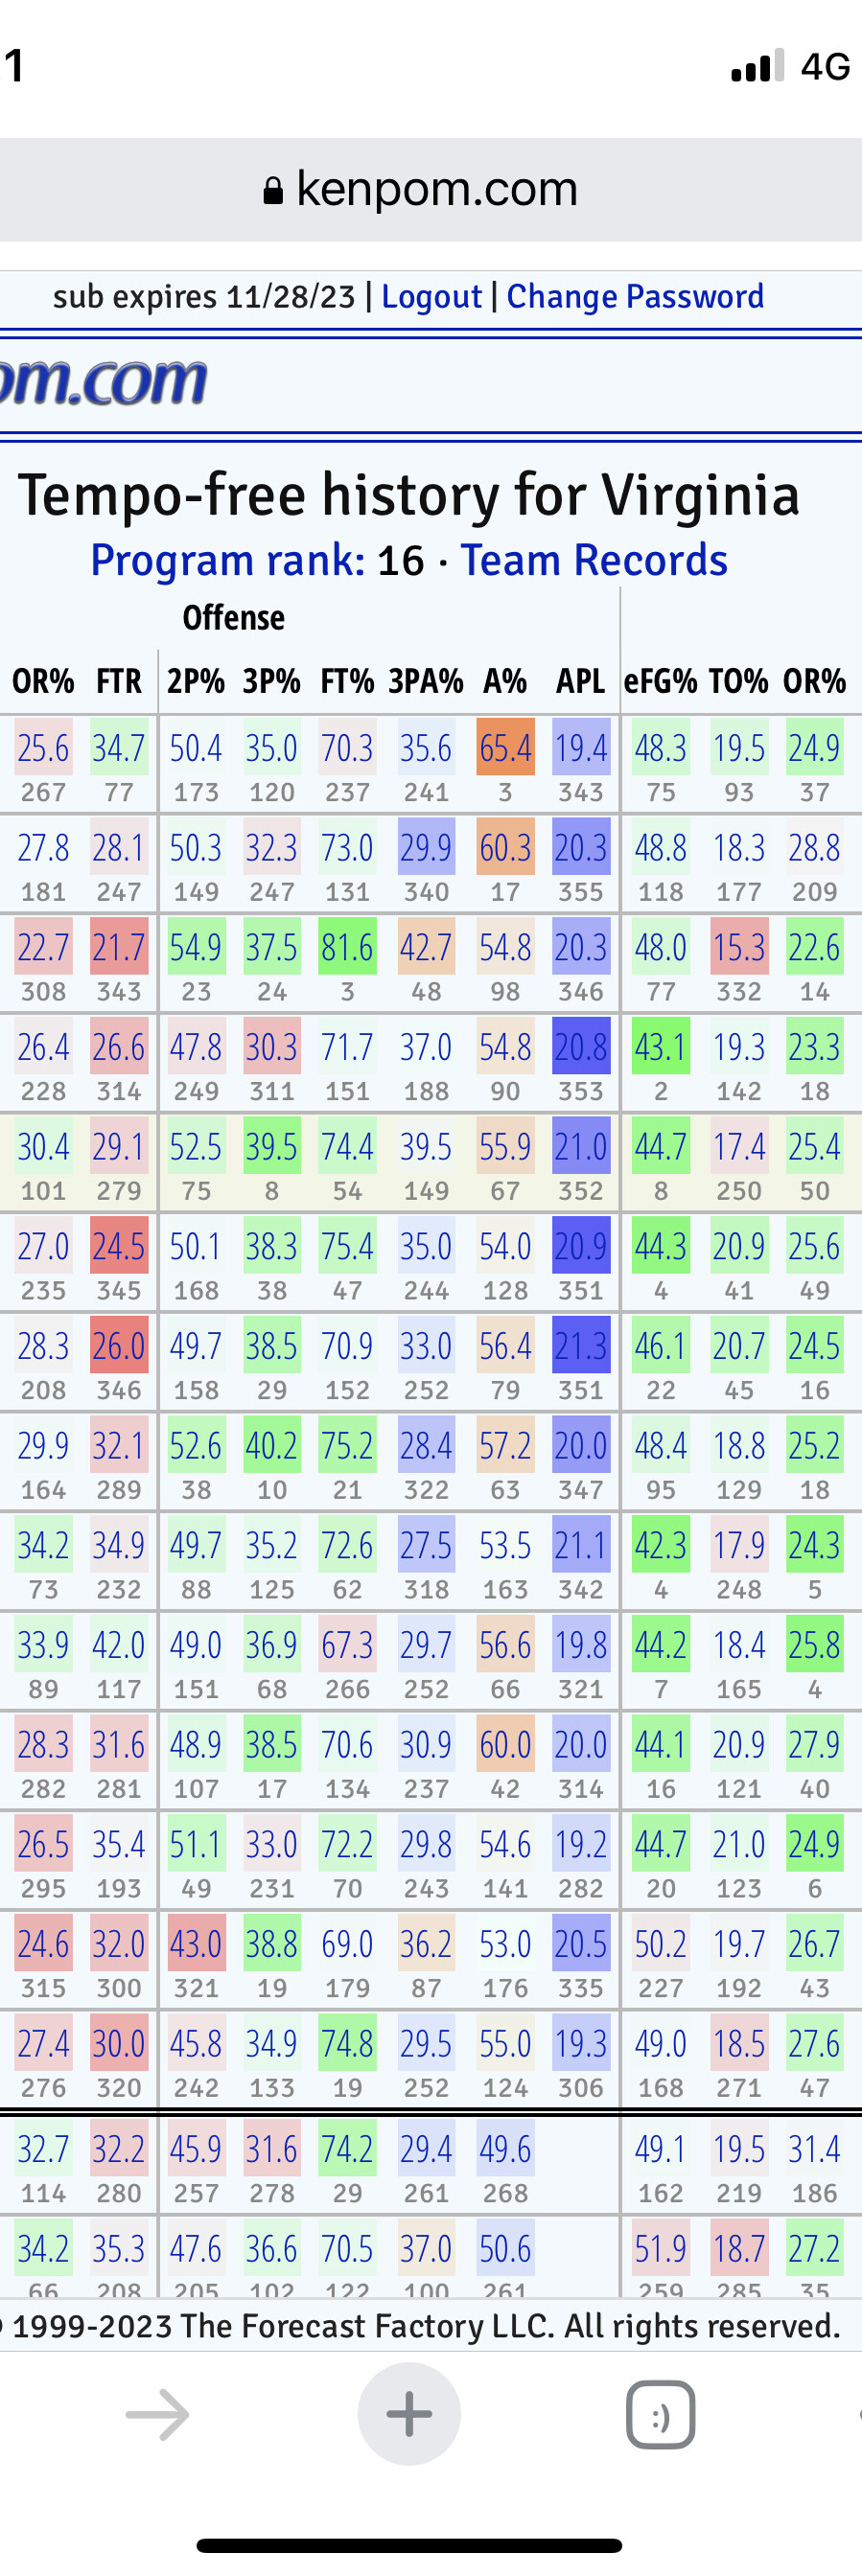
Most years we have a slight edge, some years a slight deficit. Two of our best years with nearly 5% edges were 2019 and 2016.
I think we pretty decently out-possession teams between OR% and TO%. Maybe we could do better, but I don’t think it’s our main problem in March.
Reason for that is to get an offensive rebound, you first have to miss and teams that miss less (favorable efficiency teams) are more likely to win over favorable possession teams.
That part doesn’t make sense because offensive rebounding percentage is conditional on a rebounding opportunity. In other words, the statistic is calculated only for missed shots, not per offensive possession: Offensive Rebounding Percentage Explained
The article was talking about offensive rebound volume rather than percentage.
More offensive rebounds, more possessions.
Maybe the comment talked about percentage, I’m not sure about that.
I’m not sure if there’s published work on weighting the Four Factors (shooting, rebounding, turnovers, free throws), but Dean Oliver originally gave the weights as:
- Shooting: 40%
- Turnovers: 25%
- Rebounding: 20%
- Free Throws: 15%
There was a project that looked at NBA data going back to 2005: GitHub - PatrickJWalsh/NBA-Win-Predictor: Improving Oliver's Four Factor Model
Given the impact of each factor on wins, the following weights have been determined: 1. Shooting (45.59%) 2. Turnovers (24.36%) 3. Rebounding (17.71%) 4. Free Throws (12.34%)
Haven’t found anything related to college-specific data.
1 Like
If the article is talking about raw OR volume, then it’s hard to take any lessons away from it, because as the article points out, that’s mostly a proxy for volume of misses, not a statement about success rate in offensive rebounding. At best it’s mixing multiple factors together in a way that makes it non-actionable.
But I think the commenter (unlike the article) is talking about OR%, which does get to something actionable. And a higher OR% is obviously a good thing, all other things being equal. Of course all other things aren’t equal and that’s where the strategy comes into play.
Went a little deeper and found another project that looked at 2015-2019 college basketball data: Win Prediction Using Four-Factors | Kaggle
We found out that shooting gives around 40.2%, turnover 38.3%, rebound 15.7%, and free throw 5.7%.
Ah, I see. Apologies. However, I agree with @dave92 that focusing on offensive rebounding volume is not overly useful.
I guess one could say it is a primary problem in March because we don’t shoot nearly as well in the madness and the 2 factors combine to make for upset specials. It does take the pressure off shooters if you know there’s a decent chance we get the rebound on a miss.
It’s one of the hidden reasons I think we struggle in March - fewer possessions already than all the other teams and then we don’t hit the offensive glass either. And we don’t force turnovers with the pack line style to overcome the other 2 factors. Almost like our style of play is the anti-March Madness success model.
1 Like
Jordan Sperber has written a fair amount on the 4 factors stuff. And/or some youtube videos. He’s not a data guy – he comes more from the perspective of video breakdown (was a DOBO or similar under Chris Jans, I think, maybe Muss?).
I can’t see us ever focusing on ORs, but we may get better naturally by having better/smarter athletes in the frontcourt (Blake seems to have a knack). I would like to see us put some more pressure principles in the defense, at least in the half-court, to try to get more turnovers. Basically, amongst our other various issues since the natty, and really even predating, we need better ways to get easier buckets. Or, in four factors speak, we seem to focus mostly on shooting, our own turnover % (sometimes, IMO, to the detriment of taking “good” risks), and defensive rebounding. Well, and I guess opponent shooting % obviously.
Yeah, basically we need some good “easy” ways to score. Our system doesn’t really focus on that. We obviously know we CAN win in March without them, but you wonder if we are making things unnecessarily harder on ourselves…
4 Likes
Someone mentioned Gasaway. Shot volume index is the metric he likes to track. One article from this past season:
2 Likes
Interesting analysis, but I think it leaves something out. He gets those percentages by:
- getting the effect of a one percentage point change in each on number of wins (for example for every 1% increase in eFG% teams average 0.9 more wins per season)
- Dividing each effect by the sum of all effects
But that ignores how wide the spread in each of the 4 factors is. Almost all teams have TOR% between 15 and 25%, so it would be harder to improve your TOR% by 1% than your ORB%, which is between 20 and 40%. I’m thinking that should be factored in somehow.
Would also be cool to see something similar applied to March Madness games alone
2 Likes
The correct answer is you take ((kenpom adjOE / torvik adjDE) + eFG% - Block %) * (3p%^0.5 + 4) and that should tell you everything you need to know.
2 Likes
+7.3 cm
Good point, he should have standardized the coefficients. The analysis with NBA data I linked above did do that by looking at the increase in wins connected to +1 standard deviation in each factor.
I also wonder if there’s something to be gained by including the variance of each factor/controllability by the offense or defense
4 Likes
Just to follow-up, I standardized the coefficients on that simple regression model on the 2015-2019 college data and got for weights:
eFG: 41%
TO: 28%
Reb: 20%
FT Rate: 11%
3 Likes
This is my favorite memory of Isaac Traudt.
https://twitter.com/daminaltizer/status/1649054606306217984?s=46&t=TLtc0ruA8RdBi8KFTrhv5Q
12 Likes
would love some guys with some cojones to make these baskets in a game instead of big men that literally cannot score unless they dunk
2 Likes