Yes, I believe this is true for all computer models. All seasons are small sample sizes in the big scheme of things. But the outcry would be too great to leave in preseason weights.
I believe an exception to this is in baseball. Rest of season player projections (and therefore the resultant team projections) are still considering like the previous three seasons.
KenPom explains the much-discussed coaching effect rankings:
tldr:
This is really a measure of how much did a coach’s teams out- or under-perform preseason ratings. Ken calls this measuring “talent development” and that the rest of the preseason ratings is measuring “talent acquisition”
Guys with less seasons get their coaching effect regressed towards a mean.
The size of this talent development effect is not large compared to what else goes into a team’s rating
Yeah, it could basically be described as an error term for his talent measure. He’s choosing to attach that to coaching, but it could just as easily be unrelated. Does the article talk about any persistence in the effect YoY?
Ken Pomeroy (the singer, not the stat guy) has a small recurring part in The Lowdown on FX/Hulu. Very funny modern noir for people interested in that kind of stuff.
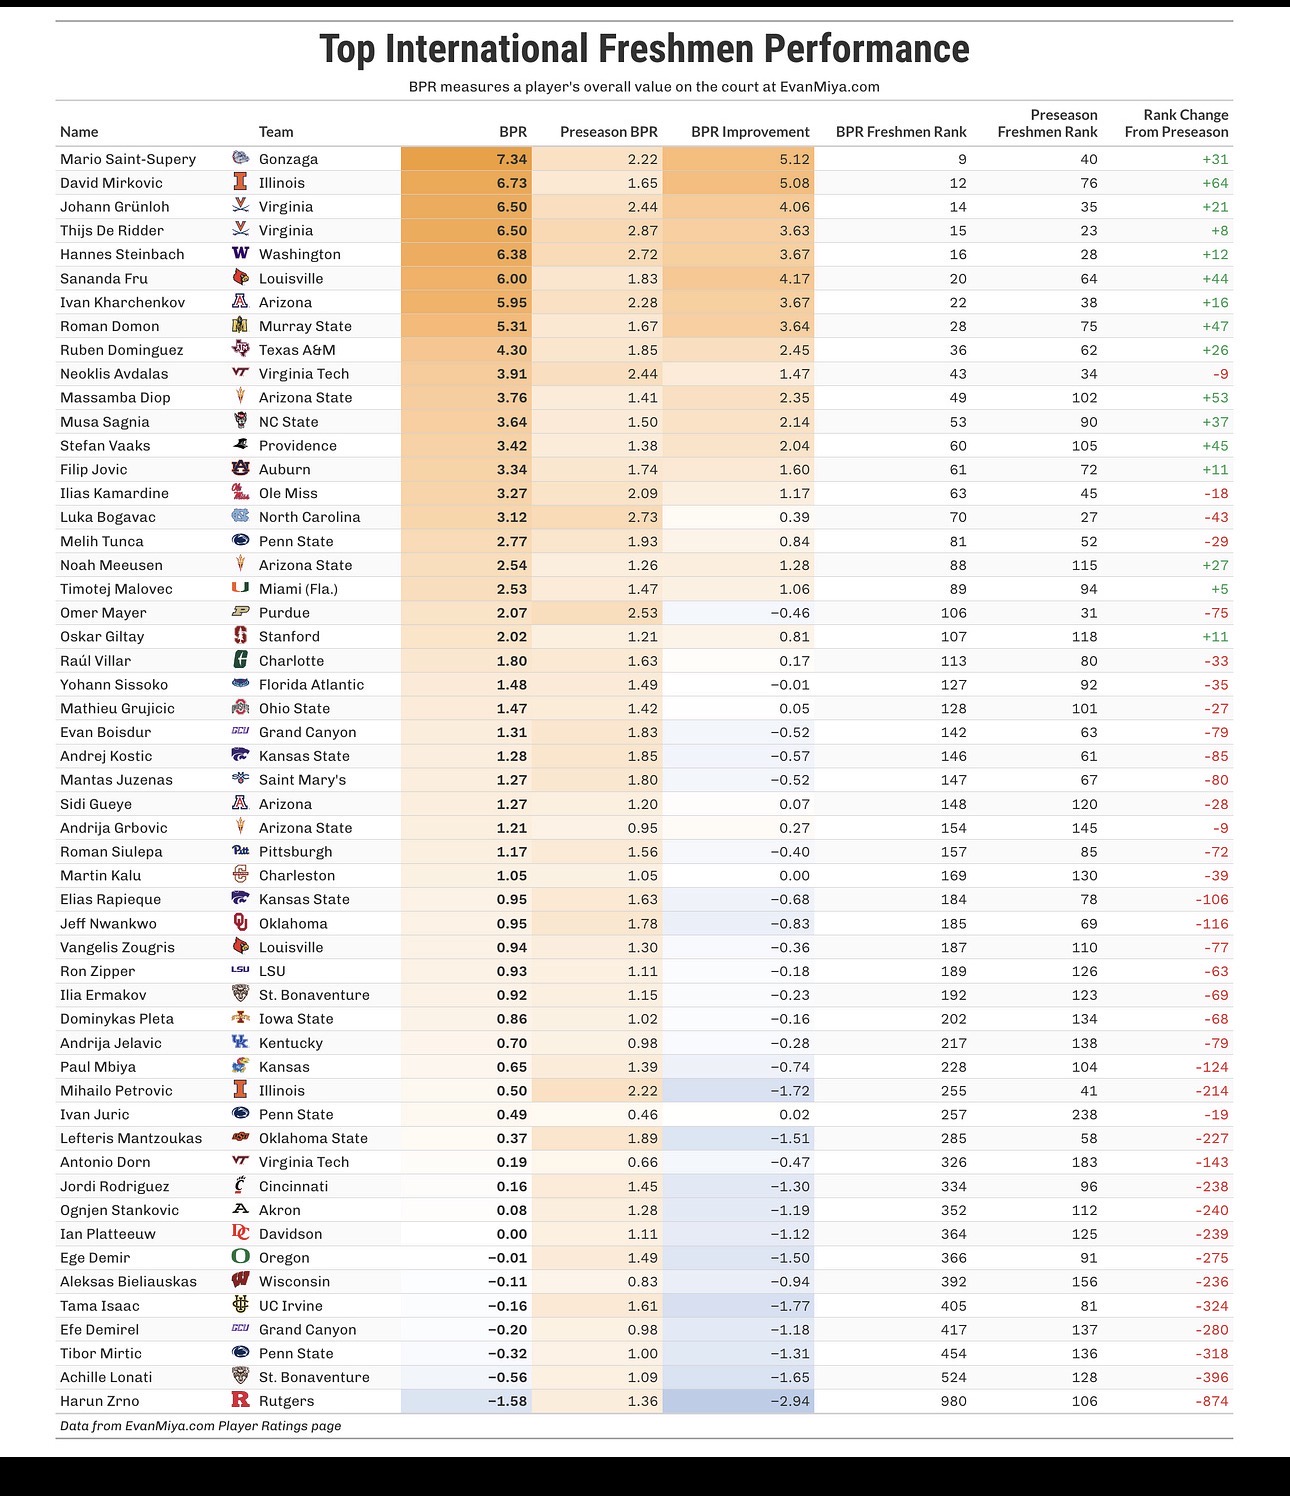
EvanMiya with a look at how international pros have fared so far this season compared to traditional freshmen and expectations.
Of note for us, De Ridder and Grünloh have been massive successes, while the most of the Euro imports have been mixed bag. Left unsaid is whether that was due to better evaluation, better coaching, or the opportunity we offered with essentially a blank roster. It’s probably a combo of all three.
Here a chart from the post that has De Ridder and Grünloh as the third and fourth best European player versus preseason expectations if you just want to look at pictures.
Gonna go with “skill diff” in evals for why our Euros have been so good. Should probably do a formal comparison, but I think Nick Kalinowski’s International player rankings have faired pretty well: International Basketball Recruits Dashboard
Saint-Supery, Gruenlooh, De Ridder, Steinbach, Fru all highly rated in Nick’s model and have done well. Demir, Zougiris, Mantzoukas all misses where Nick thought they would translate and they didn’t. Dominguez and Domon did better than Nick expected. Dorn and Zrno were guys Nick correctly didn’t rate highly.
Yeah, I’ve never been a fan of KenPom’s ranking of the conferences by the median team. It’s a different meaning of top or best than I think the average fan would consider.
E.g., in 2019, the ACC had an all-timer year. We had 5 teams in the top 15 of KenPem, and three 1-seeds, yet we were the 3rd best league per that way of ranking leagues.